As a postgraduate student, you’re likely already familiar with the importance of data analysis, organization, and presentation. Microsoft Excel, the ubiquitous spreadsheet software, is a powerful tool that can significantly enhance your academic journey. Whether you are managing research data, crunching numbers for your thesis, or creating compelling visualizations, mastering Excel can save you time and boost your productivity. In this blog post, we’ll explore some essential Excel tips and tricks tailored specifically for postgraduate students.
- Keyboard Shortcuts for Efficiency:
- Ctrl+C (Copy) and Ctrl+V (Paste): Quickly copy and paste data or formulas.
- Ctrl+Z (Undo) and Ctrl+Y (Redo): Correct mistakes with ease.
- Ctrl+S (Save): Save your work regularly to avoid losing important data.
- Ctrl+Arrow Keys: Navigate swiftly within your spreadsheet.
- Ctrl+Shift+L (Apply Filters): Efficiently filter and analyze data.
- ***MORE SHORTCUTS available on the next post***
- Data Validation:
Ensure accurate data entry and minimize errors by setting up data validation rules. This is particularly useful when collecting survey responses or managing research data. - Conditional Formatting:
Use conditional formatting to highlight important trends, outliers, or specific data points in your tables and charts. This feature is great for making your data visually appealing and easier to interpret. - Pivot Tables:
Pivot tables are incredibly powerful for summarizing and analyzing large datasets. Use them to gain insights, create cross-tabulations, and visualize trends in your research data. - Formulas and Functions:
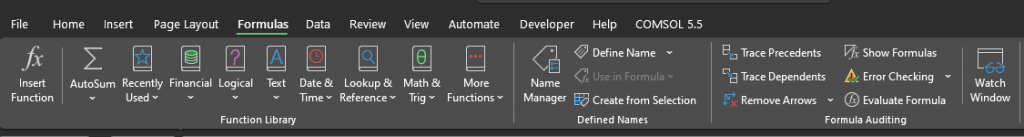
- VLOOKUP and HLOOKUP: Search for specific values in large datasets.
- SUMIF and COUNTIF: Sum or count cells based on specified criteria.
- IF functions: Create logical statements to automate data analysis.
- INDEX and MATCH: Retrieve data from specific rows and columns.
- CONCATENATE and TEXT functions: Combine text from multiple cells.
- ***MORE Formulas available on the next post***
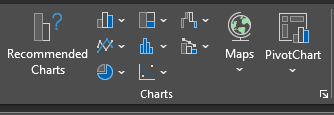
- Charts and Graphs:
Visualize your research findings using Excel’s wide range of chart types. Experiment with bar charts, line graphs, scatter plots, and more to convey your ideas effectively. - Data Cleaning:
Use Excel’s data cleaning tools to remove duplicates, correct formatting issues, and ensure consistent data entry. Clean data is crucial for accurate analysis. - Keyboard Customization:
Customize your keyboard shortcuts and create macros to automate repetitive tasks, saving you valuable time. - Collaboration:
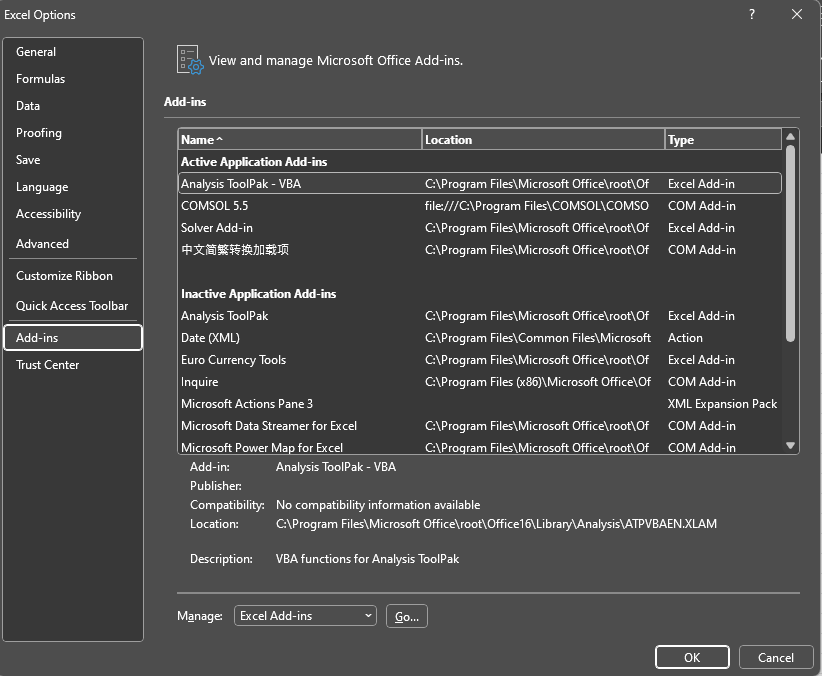
Take advantage of Excel’s collaboration features by using shared workbooks or OneDrive integration to collaborate with classmates or colleagues on group projects. - Excel Add-Ins:
Explore and install relevant Excel add-ins to extend the functionality of the software for specialized tasks such as statistical analysis, data visualization, or integration with other software.
By mastering these Excel tips and tricks, postgraduate students can streamline their data management, analysis, and presentation tasks, ultimately enhancing their academic performance. Excel is a versatile tool that, when used effectively, can make your research and coursework more efficient and impactful. Happy spreadsheeting!